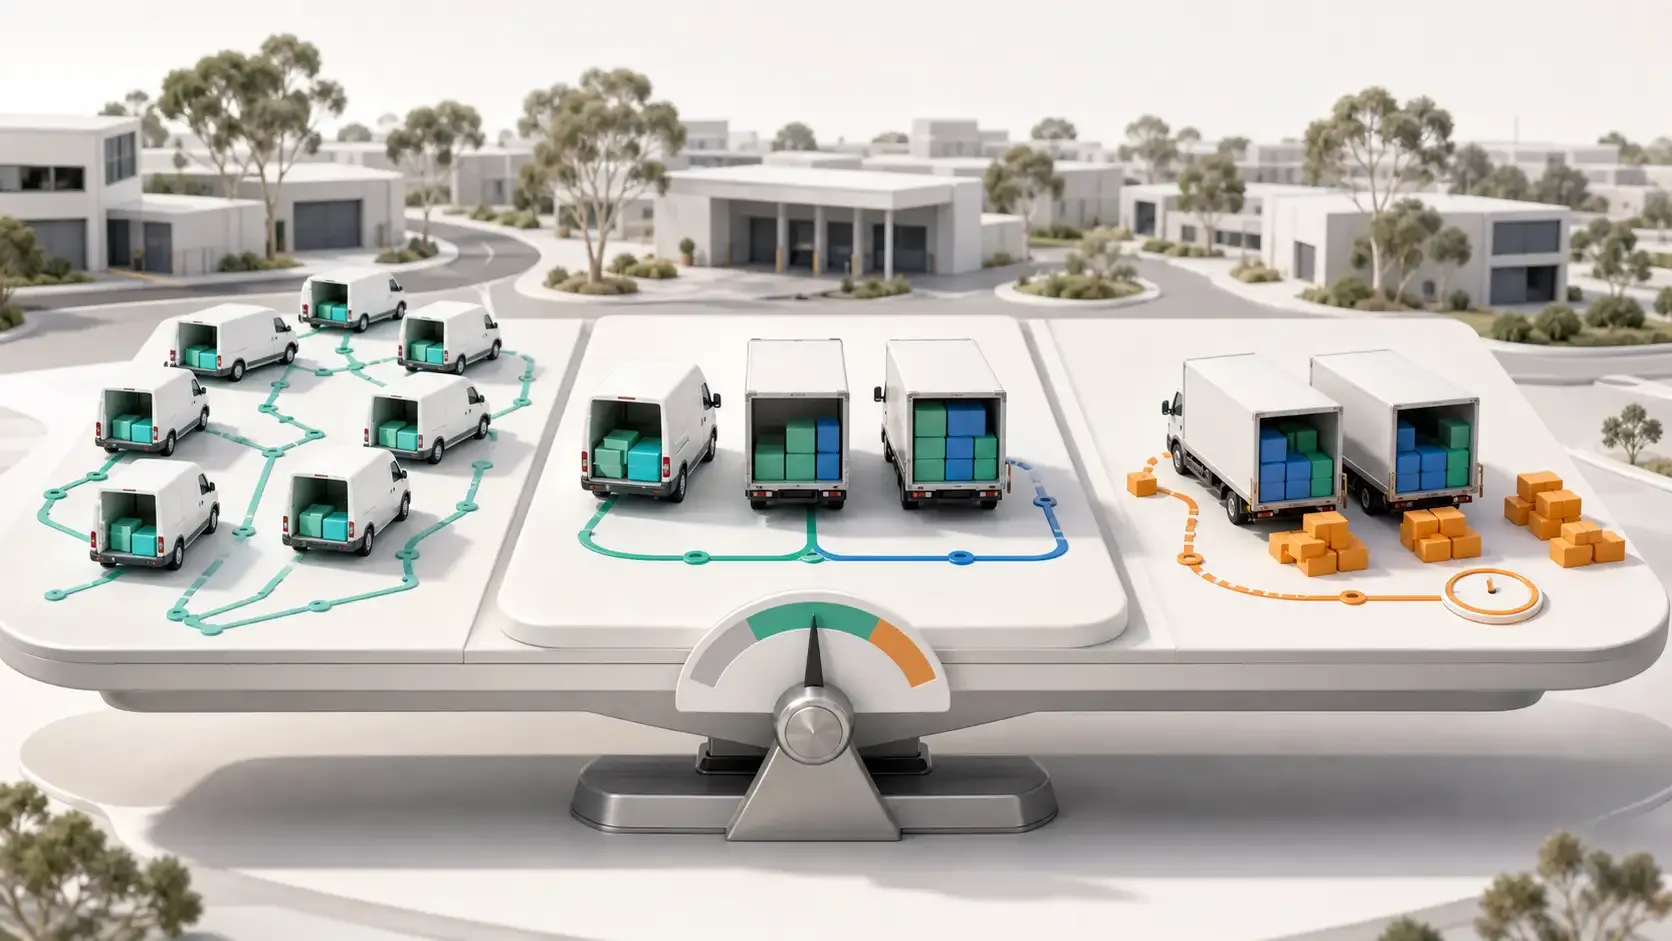
Vehicle Utilization vs Vehicle Count: What Delivery Managers Should Optimize
Using fewer vehicles and using vehicles more effectively are related but different goals. The right fleet plan balances capacity, route workload, working time, operating cost and enough flexibility to complete the delivery day.
Vehicle Utilization vs Vehicle Count in Fleets | Rouptimize
The right decision usually sits between those extremes.
Australian delivery managers need to understand how many vehicles the operation genuinely requires and how effectively each selected vehicle uses its capacity, working time and delivery potential.
What Is Vehicle Count?
Vehicle count is the number of vehicles used during a particular planning or reporting period.
Depending on the business question, it may refer to:
Vehicles used per day
Vehicles assigned to routes
Owned vehicles
Hired or contractor vehicles
Active vehicles
Vehicles available but not used
Total registered fleet size
These figures should not be treated as interchangeable.
A business may own 60 vehicles, have 55 available and use only 48 on a particular day. Each number answers a different question.
For route planning, the most useful starting point is usually the number of vehicles selected and actually required for the delivery work.
What Is Vehicle Utilization?
Vehicle utilization describes how effectively a vehicle’s available resources are used.
There is no single utilization measure.
Utilization type
What it measures
Weight utilization
Planned or actual load compared with weight capacity
Volume utilization
Cargo space used compared with vehicle volume capacity
Item utilization
Units assigned compared with item capacity
Time utilization
Route workload compared with available working time
Delivery utilization
Missions completed per vehicle
Availability utilization
Active vehicles used compared with vehicles available
Cost utilization
Delivery output compared with vehicle operating cost
A vehicle may show high weight utilization but low volume utilization. Another may complete many deliveries while travelling a short distance. A regional vehicle may carry a full load but serve relatively few locations.
Managers should identify which form of utilization is relevant to the decision being made.
Vehicle Count and Utilization Can Move in Opposite Directions
Reducing the vehicle count usually increases the workload placed on the vehicles that remain.
That may improve utilization when spare capacity genuinely exists.
It can also create:
Routes that exceed working windows
Insufficient item, weight or volume capacity
Less flexibility for delays
Higher driver workload
Missed customer time windows
Unassigned missions
Additional risk when one vehicle becomes unavailable
Adding vehicles can reduce route workload and improve schedule resilience, but it may also create avoidable fixed, contractor or administrative cost.
The goal is not the smallest possible fleet. It is the appropriate set of vehicles for the work and service commitments.
What a Six-Day Benchmark Shows
An anonymized six-day comparison used real delivery data to compare existing operations with an optimized planning model.
Operational metric
Existing operation
Optimized planning result
Calculated change
Average missions per vehicle
18
21
16.7% higher
Average working time per vehicle
436 minutes
294 minutes
32.6% lower
Average distance per vehicle
56 km
44 km
21.4% lower
Vehicles used during the reporting period
64
55
14.1% fewer
The model used fewer vehicles while increasing average missions per vehicle.
At the same time, average working time and distance per vehicle were lower.
This matters because it shows a broader improvement than simply forcing more work into fewer vehicles. Mission allocation, route structure and vehicle selection changed together.
*Benchmark note: This is an anonymized historical planning comparison, not an Australian customer case study or audited post-deployment saving. The results represent a model based on real operational data. Australian outcomes will depend on fleet mix, geography, service duration, customer windows and data quality.*
A Capacity Dataset Shows Why Vehicles Are Not Interchangeable
A separate anonymized dataset provides another view of fleet utilization.
Fleet measure
Recorded value
Available vehicles
55
Total listed fleet capacity
46.6 tonnes
Approximate average listed capacity
847 kg
Vehicle capacity range
600–6,000 kg
Daily invoice volume across reviewed dates
1,418–1,439
Reported missions per vehicle
28–32
Reported capacity utilization
88%–99%
The largest listed vehicle had ten times the weight capacity of the smallest.
This means the total of 46.6 tonnes could not be divided freely between routes. Capacity belonged to specific vehicles with their own availability, working windows and operating characteristics.
*Dataset note: These values come from a different historical operational dataset. Its mission and utilization definitions should not be compared directly with the six-day benchmark. The reported 88%–99% utilization range is not an Australian result or recommended target.*
Different datasets should remain separate unless their definitions, periods and calculation methods match.
Why Fewer Vehicles Can Improve Utilization
A fleet may use more vehicles than necessary when:
Nearby missions are divided between several routes
Vehicles are selected before daily demand is understood
Orders are planned in separate batches
Route overlap is not reviewed
Capacity data is missing
Historical driver territories remain fixed
Late orders are added without recalculating the plan
Work is assigned manually to the next available vehicle
In these situations, better route allocation may place more productive work on each selected vehicle while reducing duplicated travel.
Route optimization software helps evaluate missions, vehicles, capacity, time windows, depots and working hours together.
The result should still be reviewed before dispatch.
Why Fewer Vehicles Can Also Create Risk
The smallest mathematically possible vehicle count may leave the operation without enough flexibility.
Suppose every planned vehicle is close to its weight, volume and working-time limit. A late mission, extended service stop or vehicle problem could then make several routes infeasible.
A resilient fleet plan may include some operating buffer for:
Normal delivery variation
Late order changes
Additional pickups
Incorrect quantities
Customer waiting
Route reassignment
Vehicle unavailability
Traffic or access delays
Buffer should be intentional and measured. It should not become an excuse for consistently poor utilization, but removing it completely can make the delivery plan fragile.
High Capacity Utilization Is Not Automatically Better
A vehicle planned at 99% utilization may look efficient.
Before treating that result as successful, managers should ask:
Which capacity dimension is at 99%?
Is the mission data accurate?
Does the plan allow for packaging variation?
Are additional pickups possible?
Does the route fit the available time?
Is the vehicle suitable for every location?
Was the planned load actually carried?
Were all deliveries completed?
High utilization in one dimension can hide spare capacity or excessive pressure in another.
For example, a vehicle may be 95% full by volume but only 50% utilized by weight. Another may be fully loaded but assigned to a route that cannot fit within the driver’s working window.
Time Utilization Matters as Much as Load Utilization
Vehicles are not productive simply because they leave the depot full.
A route can use capacity well while spending too much time travelling, waiting or serving an inefficient stop sequence.
Managers should compare:
Planned route hours
Actual route hours
Vehicle availability
Driver availability
Service duration
Missions completed
Distance
Capacity utilization
A vehicle operating for eight hours and completing every mission may be more valuable than one operating for ten hours with an incomplete route, even if both left with similar loads.
Combining more deliveries into fewer vehicles may appear efficient until customer time windows are considered.
If one route cannot reach every customer within the accepted period, the operation may experience:
Waiting
Late arrival
Failed delivery
Driver reassignment
Redelivery
Customer-service contact
Additional planning work
The right vehicle count must support the required service level.
A slightly lower utilization rate may be appropriate when narrow customer windows prevent further consolidation.
Dispatcher Review Protects the Plan
The optimizer can apply recorded constraints, but dispatchers still need to evaluate operational reality.
On the dispatcher map, managers can review route geometry, duration, distance, stop order, missions and driver or vehicle assignments.
A utilization review should ask:
Is every route assigned to a suitable vehicle?
Does the work fit item, weight and volume capacity?
Does the route fit the valid working window?
Are workloads balanced across drivers?
Is spare capacity located where it can be useful?
Does the plan contain a reasonable operating buffer?
Is any work still unassigned?
Would removing another vehicle damage service reliability?
The objective is a practical fleet plan, not the strongest-looking percentage.
Measuring Underutilization
Underutilization can have several causes.
Observed result
Possible cause
Low missions per vehicle
Low demand, poor grouping or excessive vehicle count
Low weight utilization
Small loads or unsuitable vehicle selection
Low volume utilization
Compact goods or oversized vehicles
Low time utilization
Short routes, narrow customer windows or early completion
High kilometres per mission
Low delivery density or route overlap
Many inactive vehicles
Maintenance, seasonal demand or excess fleet
Spare capacity with unassigned missions
Skills, time windows, depot or data constraints
The metric identifies the symptom. Managers still need to investigate the cause.
A Balanced Daily Planning Process
Australian delivery teams can use this workflow:
Confirm active vehicles and drivers for the planning date.
Update item, weight and volume capacity.
Record valid working windows, skills and depot context.
Import missions with accurate quantities and time windows.
Generate routes using the available fleet.
Review vehicle count, capacity, hours, distance and unassigned work.
Compare alternative plans rather than accepting the lowest vehicle count automatically.
Review assignments on the dispatcher map.
Send approved routes to drivers.
Record completion and significant exceptions.
Compare planned and actual utilization.
Revise fleet data and planning decisions for the next cycle.
This creates a repeatable balance between resource use and operational resilience.
Metrics Delivery Managers Should Track
A useful vehicle-utilization scorecard can include:
Vehicles available
Vehicles selected for planning
Vehicles assigned
Vehicles actually used
Missions per vehicle
Item utilization
Weight utilization
Volume utilization
Planned hours per vehicle
Actual hours per vehicle
Kilometres per vehicle
Kilometres per completed mission
Unassigned missions
Failed and rescheduled deliveries
Contractor vehicles used
Cost per completed delivery
The guide to cost-per-delivery metrics explains how these measures contribute to the wider financial result.
Rouptimize’s reports and analytics keep route, mission, driver and fleet results connected to the operational workflow.
Do Not Optimize Every Day in Isolation
A single delivery day may be unusual.
Fleet managers should review utilization across:
Normal operating days
Peak days
Seasonal periods
Different depots
Metropolitan and regional routes
Vehicle classes
Customer segments
Service levels
Patterns across time are more useful for fleet decisions than one exceptionally high or low utilization result.
The objective is to understand recurring resource requirements and where planning decisions can improve them.
Utilization Can Influence Customer Experience
Better vehicle allocation may help the operation:
Avoid capacity-related delivery failures
Reduce last-minute vehicle changes
Create clearer driver workloads
Keep routes inside customer time windows
Respond to exceptions with available capacity
Reduce preventable redelivery work
Maximum utilization can create the opposite result if every route lacks flexibility.
Customer satisfaction depends on completing the promised work, not on displaying the highest possible fleet percentage.
Optimize the Fleet Plan, Not One Percentage
Vehicle count shows how many resources the operation used.
Vehicle utilization shows how those resources were used.
Neither measure is sufficient alone.
The strongest fleet plan balances vehicles, capacity, route hours, distance, customer commitments and enough operating flexibility to complete the delivery day.
Start free with Rouptimize and compare vehicle count, route workload and fleet utilization using your own delivery data.
Results-oriented and visionary CEO with a passion for innovation and a track record of transforming startups into industry leaders. Seeking a leadership role in a dynamic startup environment where I can leverage my strategic acumen, entrepreneurial spirit, and hands-on experience to drive growth, build high-performing teams, and deliver unparalleled value to customers. Committed to fostering a culture of creativity, adaptability, and sustainable success.
Vehicle utilization measures how effectively a vehicle’s capacity, time or delivery potential is used. It can be calculated using items, weight, volume, working hours, missions or cost.
Is vehicle utilization the same as fleet utilization?
Vehicle utilization describes an individual vehicle. Fleet utilization usually aggregates resource use across the available fleet.
Should every delivery vehicle be fully utilized?
No. The appropriate level depends on data accuracy, route risk, customer windows, vehicle type and the need for operating flexibility.
Does using fewer vehicles always reduce cost?
No. It may reduce contractor or variable cost, but it can also create longer routes, more labour time or delivery risk. Owned-vehicle fixed costs may remain.
What is a useful vehicle-productivity metric?
Missions per vehicle is useful when reviewed with capacity, hours, distance, route type and completed-delivery results.
Can route optimization improve vehicle utilization?
It can help allocate missions across available vehicles using recorded capacity, working hours and other constraints. Actual improvement depends on data quality and operational adoption.
How should fleet managers compare utilization?
Use consistent definitions and segment results by vehicle type, depot, route environment and service requirement.
 Mohammad AlavitabarCEO @ Rouptimize