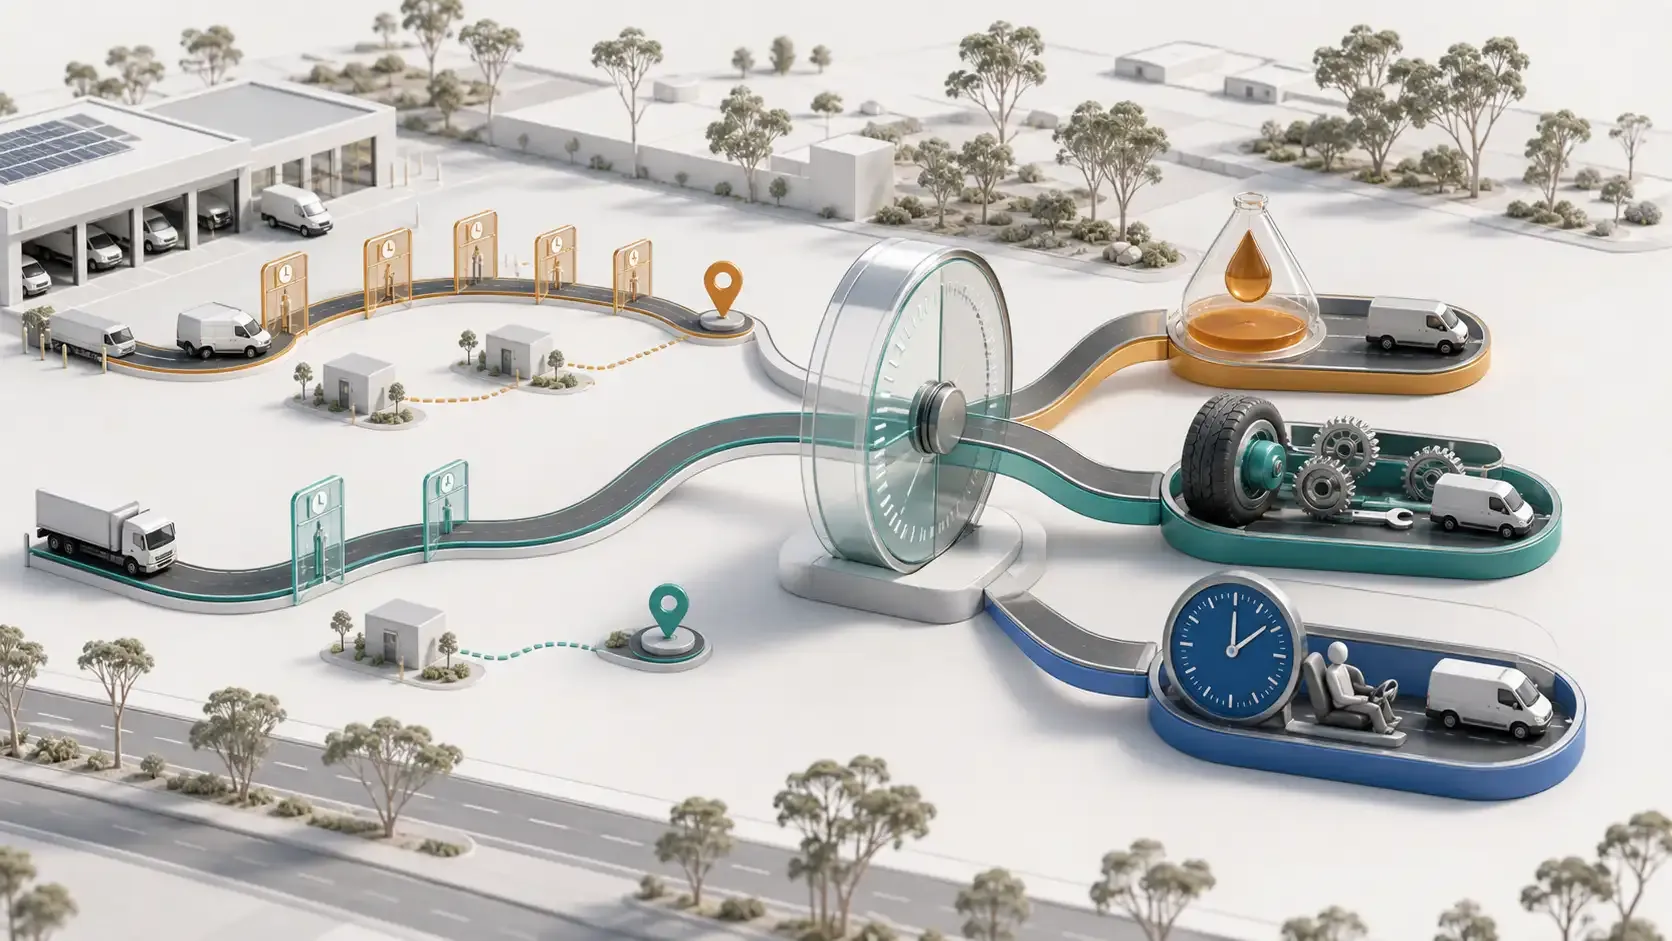
How Vehicle Kilometres Affect Fuel, Maintenance and Labour Costs
Vehicle kilometres influence several delivery costs, but the relationship is not one-to-one. Fuel use, maintenance exposure and driver time also depend on vehicle type, route conditions, stop density and service duration.
Every route has a planned distance, and every fleet can compare how far its vehicles travel over a day, week or month.
The harder question is how those kilometres translate into delivery cost.
Additional distance can increase fuel consumption, tyre and maintenance exposure, vehicle use and driver travel time. But the relationship is not perfectly proportional.
How Vehicle Kilometres Affect Delivery Costs | Rouptimize
A shorter route may travel through slower areas, contain more stops or require more service time. A longer route may use faster roads and take fewer total working hours.
Australian delivery managers therefore need to measure kilometres alongside time, vehicles, workload and completed deliveries.
Why Vehicle Kilometres Matter
Distance creates or influences several operating costs.
Cost area
How kilometres can affect it
Other important variables
Fuel or energy
More travel generally requires more energy
Vehicle type, load, speed, idling and road conditions
Maintenance
Travel contributes to tyre and component wear
Vehicle age, service policy, route surface and driving conditions
Driver labour
More distance can increase travel time
Traffic, stop density, waiting and service duration
Vehicle value
Use can affect depreciation and replacement timing
Ownership model, age and market conditions
Tolls and route charges
Route selection may expose vehicles to charges
Geography, vehicle class and operating policy
Fleet requirements
Inefficient route allocation can create extra vehicle demand
Capacity, working hours and customer windows
Delivery completion
Long travel can reduce time available for stops
Service duration, route workload and priorities
Distance is important because it touches several cost categories at once.
It should still be treated as one input rather than a complete measure of delivery efficiency.
What a Four-Depot Planning Analysis Shows
An anonymized one-day route-planning analysis compared a recorded operation with several modelled alternatives.
Planning scenario
Vehicles
Total operating hours
Total distance
Recorded baseline
55
530 hours
3,619 km
Time-focused plan
51
521 hours
3,201 km
Distance-focused plan
51
554 hours
2,939 km
Longer vehicle-availability scenario
47
519 hours
3,101 km
The distance-focused plan produced the lowest total kilometres.
Compared with the time-focused plan, it travelled 262 fewer kilometres but required 33 additional operating hours.
That is the central trade-off.
A delivery manager looking only at distance would select the 2,939 km plan. A manager with high labour costs might prefer the 3,201 km plan because it required fewer total hours.
The correct decision depends on the business’s vehicle, labour and service costs.
*Benchmark note: This is an anonymized historical planning analysis using real operational data. The alternative plans were modelled, not audited post-deployment results or Australian customer implementations. Australian outcomes will vary according to local costs, geography, traffic, fleet mix and delivery requirements.*
A Larger Dataset Shows the Scale Distance Planning Can Influence
A separate anonymized dataset compared distance in existing route records with a modelled route plan.
Distance measure
Recorded value
Distance in existing route records
152,282 km
Distance in the modelled plan
85,714 km
Difference
66,568 km
Calculated difference
43.7% lower
Reduction stated in the source report
43%
The comparison shows that route structure can influence a substantial amount of travel across a large delivery dataset.
It does not demonstrate a 43% reduction in total operating cost.
The modelled distance difference would need to be valued using:
Vehicle-specific fuel or energy consumption
Fuel or energy prices during the operating period
Maintenance cost by vehicle class
Driver and contractor cost
Route hours
Vehicle requirements
Completed-delivery performance
Implementation results
*Dataset note: The values compare recorded route distance with a modelled alternative based on real operational data. They are not measured Australian fuel, maintenance or financial savings.*
Fuel Cost Depends on More Than Kilometres
Distance provides a useful starting point for estimating fuel cost.
A basic estimate combines route kilometres with the vehicle’s consumption rate and the applicable fuel price.
However, two vehicles travelling the same distance may consume different amounts because of:
Vehicle size and engine type
Load weight
Stop-start driving
Idling
Road speed
Gradient
Air conditioning and auxiliary use
Vehicle condition
Driver behaviour
A metropolitan route with frequent stops may consume more fuel per kilometre than a steady regional route.
This means managers should track both:
Kilometres travelled
Fuel or energy consumed
Fuel records may come from another fleet, finance or telematics system. Rouptimize’s role is to provide route, vehicle, distance and operational context that can be combined with those records.
Use Vehicle-Specific Distance Costs
A single fleet-wide cost per kilometre can be useful for high-level analysis, but it may hide major vehicle differences.
A compact van and a large truck can have different:
A more accurate distance-cost model groups vehicles by type or uses a vehicle-specific rate where reliable data is available.
The purpose is not to create a perfect theoretical number. It is to prevent a kilometre travelled by every vehicle from being valued identically when the underlying cost is materially different.
Maintenance Exposure Accumulates With Use
Vehicle travel contributes to maintenance demand.
Depending on the fleet, distance may influence:
Scheduled servicing
Tyre replacement
Brake wear
Suspension and steering components
Fluids and consumables
Breakdown exposure
Vehicle replacement planning
Maintenance cost does not necessarily increase smoothly with every kilometre. A major service or repair can make one month appear unusually expensive.
Managers can improve the analysis by reviewing maintenance cost over a longer period and calculating:
Maintenance cost per kilometre
Tyre cost per kilometre
Maintenance cost by vehicle class
Unplanned maintenance events
Vehicle downtime
Distance between service events
Route optimization cannot determine the mechanical condition of a vehicle. It can help reduce avoidable travel and preserve a route history that can be compared with maintenance records.
Driver Labour Is Related to Time, Not Distance Alone
Distance often increases driver time, but it is not the same thing as working time.
A driver’s route can include:
Loading
Depot preparation
Travel
Parking
Customer access
Waiting
Unloading or service
Delivery confirmation
Scheduled non-driving activities
Return travel
End-of-route work
A route covering 40 kilometres with many service-intensive stops may take longer than a 70-kilometre route containing a few regional deliveries.
The four-depot benchmark demonstrates this directly. The lowest-distance plan required 33 more operating hours than the time-focused alternative.
Australian fleets can operate across very different route environments.
Metropolitan routes
These may contain shorter travel legs but more stops, parking constraints, customer access time and traffic variation.
Outer-suburban routes
These may combine longer travel with moderate stop density and different customer windows.
Regional routes
These may involve substantial distance between customers but fewer stops and less service density.
Comparing kilometres without considering route type can lead to poor conclusions.
A regional driver may record a high distance per delivery while completing the most practical route possible. A metropolitan route may show low distance but high labour time.
Segmenting the data helps managers understand whether additional kilometres are avoidable or inherent to the service area.
Empty and Repositioning Kilometres Need Attention
Not all vehicle kilometres directly serve a delivery.
Travel can occur when a vehicle:
Moves from its depot to the first stop
Returns after the final stop
Repositions between delivery areas
Travels to collect transferred work
Returns for goods that did not fit
Repeats a failed delivery
Moves without a productive load
Where reliable data is available, managers can distinguish productive route distance from empty or corrective travel.
This does not mean every non-delivery kilometre is waste. Depot travel and repositioning may be necessary.
The objective is to identify distance created by avoidable planning or execution problems.
Route Overlap Creates Quiet Distance Waste
One of the most common planning opportunities is not one extremely long route. It is several routes serving the same area inefficiently.
Route overlap can occur when:
Orders are planned in separate batches
Drivers retain historical territories regardless of daily demand
Late missions are added without recalculating the wider plan
Capacity problems force last-minute route splitting
Depots plan independently
Manual planners focus on one route at a time
A route optimization system evaluates missions and vehicles together, helping dispatchers see how changes affect the complete fleet plan.
The potential distance reduction should still be reviewed against hours, capacity and customer commitments.
Capacity Can Change the Distance Result
A low-distance plan may group many nearby deliveries into one route.
If the assigned vehicle cannot carry the combined item count, weight or volume, the operation may need to add another trip or split the work.
That can increase actual distance beyond the original plan.
Accurate fleet capacity data helps the optimizer allocate missions to vehicles that can perform the route.
Distance planning without capacity planning can produce an attractive result that does not survive loading.
Fewer Kilometres Do Not Automatically Mean Fewer Vehicles
Distance and vehicle count can move differently.
A route plan may reduce total kilometres while still requiring the same number of vehicles because of:
Working-hour limits
Customer time windows
Vehicle capacity
Required skills
Depot constraints
Service duration
Route completion risk
The four-depot benchmark used 51 vehicles in both the time-focused and distance-focused plans, even though their distance and total hours differed.
Managers should evaluate vehicle count as a separate cost driver.
For contracted or hired vehicles, reducing the daily requirement may create an immediate financial effect. For owned vehicles, it may create spare capacity or delay future investment rather than reducing the current day’s fixed cost.
Build a Complete Route-Cost Model
A practical route-cost comparison can contain four layers.
Cost layer
Operational inputs
Distance-related cost
Kilometres and vehicle-specific cost per kilometre
Time-related cost
Driver and vehicle hours with applicable labour or contractor rates
Vehicle cost
Owned, leased, hired or contractor vehicles used
Exception cost
Failed deliveries, redelivery, route changes and additional administration
This prevents distance from carrying financial meaning it cannot support by itself.
A route with the lowest kilometre total may still cost more if it requires substantially more working hours or an additional vehicle.
Planned and Actual Distance Should Be Compared
Planned distance shows what the route design expected.
Actual or completed distance, where available, shows what occurred during execution.
A material difference can indicate:
Route changes after dispatch
Driver deviation
Incorrect location data
Reassigned missions
Failed deliveries
Additional depot travel
A route plan that did not reflect operational reality
The comparison should be used to improve planning data rather than automatically attributing the difference to driver performance.
Live delivery monitoring helps keep active driver, vehicle and mission context visible during the delivery day.
Metrics Australian Fleet Managers Should Track
Useful distance and cost measures include:
Total fleet kilometres
Kilometres per vehicle
Kilometres per route
Kilometres per completed mission
Planned versus actual distance
Distance by vehicle class
Distance by depot
Distance by route type
Fuel or energy consumed per kilometre
Maintenance cost per kilometre
Driver hours per completed mission
Service minutes per stop
Vehicles used
Failed and repeated deliveries
Cost per completed delivery
Rouptimize’s reports and analytics keep route distance, duration, mission, driver and fleet results close to the operating workflow.
Fuel, maintenance and financial data should be combined from the relevant business systems when calculating actual costs.
A Practical Distance-Reduction Workflow
Australian delivery teams can use this process:
Establish a baseline using representative delivery periods.
Separate routes by depot, vehicle type and operating area.
Confirm accurate mission locations and service durations.
Keep vehicle capacity, availability and working windows current.
Generate alternative route plans.
Compare kilometres, total hours, vehicles and unassigned work.
Review the plan before dispatch.
Assign the correct driver and vehicle.
Record delivery completion and significant exceptions.
Compare planned and actual route performance.
Combine distance with fuel, maintenance and labour data.
Revise route settings and source data for the next cycle.
This turns distance reduction into a controlled operating process rather than a one-time routing exercise.
Avoid Common Distance-Cost Mistakes
Treating kilometre reduction as total cost reduction
A 15% reduction in distance does not prove a 15% reduction in total delivery cost.
Using one cost rate for every vehicle
Different vehicles can create materially different fuel, maintenance and ownership costs.
Ignoring driver hours
The shortest route may require more service or working time.
Excluding failed deliveries
A low-distance day may simply have left more work incomplete.
Comparing different route types
Metropolitan and regional routes need operational context.
Measuring only planned distance
Execution changes can create additional travel after dispatch.
Ignoring fixed costs
Using fewer kilometres does not immediately remove every vehicle or labour cost.
Customer Experience Can Also Be Affected
Avoidable distance can reduce the time available for customer service and delivery completion.
Route overlap, late route splitting or an unnecessary depot return may contribute to:
Later arrivals
Missed time windows
Driver reassignment
Failed delivery attempts
Additional customer contact
Redelivery work
Better route planning can reduce some of these operational risks.
The historical distance benchmarks do not directly measure customer satisfaction, retention, sales or marketing costs. Those outcomes need to be evaluated using customer-service and commercial data.
Value Kilometres in Their Full Operational Context
Vehicle kilometres matter because they influence more than one delivery cost.
But distance should never be evaluated alone.
The strongest decisions compare kilometres with vehicle type, fuel use, maintenance history, driver hours, fleet requirements and completed delivery outcomes.
Start free with Rouptimize and compare route distance, duration and fleet use using your own delivery data.
Results-oriented and visionary CEO with a passion for innovation and a track record of transforming startups into industry leaders. Seeking a leadership role in a dynamic startup environment where I can leverage my strategic acumen, entrepreneurial spirit, and hands-on experience to drive growth, build high-performing teams, and deliver unparalleled value to customers. Committed to fostering a culture of creativity, adaptability, and sustainable success.
They can influence fuel or energy use, maintenance exposure, driver travel time, tolls and vehicle utilisation. The financial effect depends on vehicle type, route conditions and cost structure.
Does reducing kilometres reduce fuel cost by the same percentage?
Not necessarily. Fuel consumption also depends on vehicle type, load, traffic, idling, speed and driving conditions.
Why can a shorter route take longer?
A shorter route may contain more stops, waiting, customer access or service activity. Distance and operating time are related but separate measures.
Should maintenance cost be calculated per kilometre?
Cost per kilometre can be useful over a suitable reporting period, especially when segmented by vehicle type. Individual months may be distorted by major repairs.
What is a useful distance-efficiency metric?
Kilometres per completed delivery provides more context than total distance because it relates travel to successful output.
Can route optimization reduce vehicle kilometres?
It can identify lower-distance plans while considering the constraints supplied. Actual results depend on input data, operational adoption and delivery conditions.
Does Rouptimize track fuel and maintenance costs?
Rouptimize provides route, distance, duration, mission, driver and fleet context. Actual fuel and maintenance data may need to come from the business’s fleet, telematics, finance or service systems.
 Mohammad AlavitabarCEO @ Rouptimize