Cost per Delivery: Which Route, Driver and Fleet Metrics Should Managers Track?
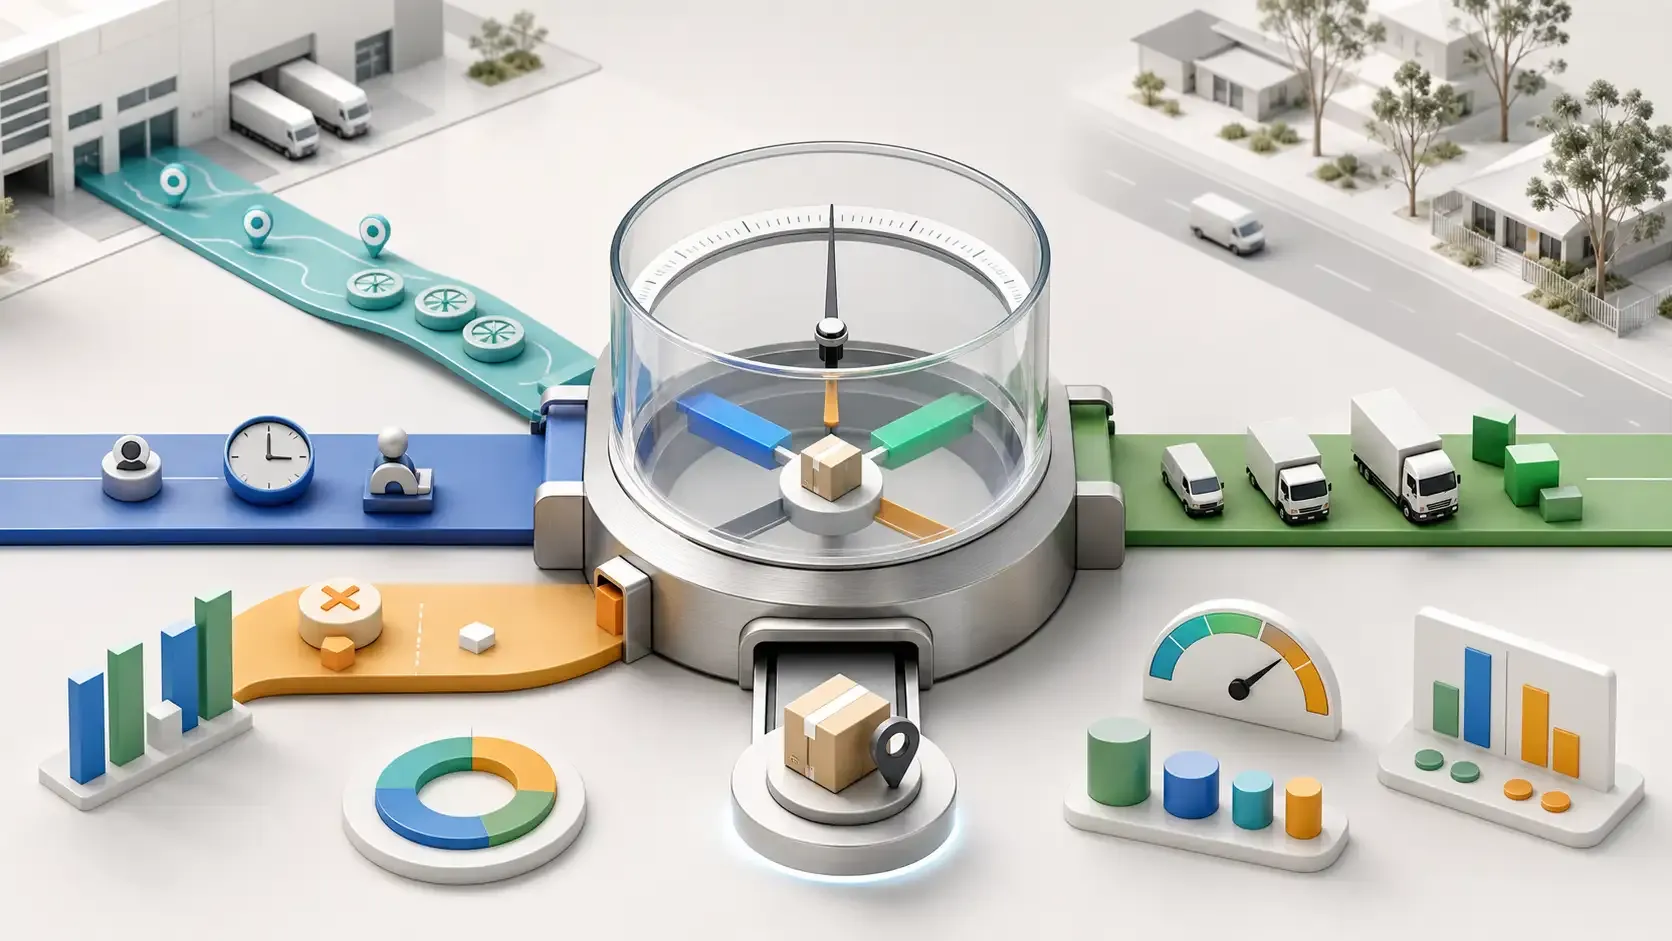
Cost per delivery is an outcome, not a diagnosis. Managers need connected route, driver, fleet, mission and financial data to understand why the number changes and which operational decision to revise.
Cost per Delivery Metrics for Fleets! | Rouptimize
That makes cost per delivery a useful outcome metric, but a poor diagnostic metric on its own. It tells managers whether the operation is becoming more or less expensive. It does not explain why.
Australian delivery teams need to connect the final cost with route, driver, fleet, mission and planning measures that reveal where the change occurred.
How to Calculate Cost per Delivery
At its simplest:
**Cost per completed delivery = total delivery operating cost divided by completed deliveries**
The two most important words are “operating cost” and “completed.”
The operation needs a consistent definition of which costs are included and which delivery outcome forms the denominator.
Possible cost components include:
Driver wages and related labour costs
Fuel
Distance-related maintenance
Vehicle ownership, lease or hire
Contractor costs
Tolls and route-specific charges
Planning and dispatch labour
Delivery technology
Failed-delivery and redelivery work
Other directly attributable operating expenses
The denominator should normally represent completed deliveries rather than dispatched missions. Otherwise, a day containing many failed attempts may appear more productive than it really was.
Define the Metric Before Comparing It
Different businesses can calculate cost per delivery differently.
Definition choice
Question to answer
Completed delivery
Which final mission statuses count as completed?
Delivery attempt
Are failed attempts reported separately?
Operating cost
Which labour, fleet and administrative costs are included?
Fixed vehicle cost
Is it allocated by day, route, hour or kilometre?
Shared overhead
Is it included, excluded or allocated consistently?
Reporting period
Is the measure daily, weekly or monthly?
Service type
Are standard, urgent and specialized deliveries separated?
Geography
Are metropolitan, outer-suburban and regional routes compared separately?
A consistent definition is more valuable than a sophisticated formula that changes between reports.
Cost per Delivery Needs Diagnostic Metrics
The headline number becomes useful when it can be traced to operational drivers.
Metric group
Questions it helps answer
Route metrics
Did distance, route duration or stop density change?
Driver metrics
Did working time or completion productivity change?
Fleet metrics
Were more vehicles or more capacity used?
Mission metrics
How much assigned work was completed successfully?
Planning metrics
How much manual effort and route correction was required?
Customer metrics
Did failures create complaints, redeliveries or service work?
Financial metrics
How did labour, vehicle and distance costs change?
Rouptimize’s reports and analytics keep route, mission, driver and fleet results close to the delivery workflow.
Finance and customer-service information may still need to be combined with those operational reports to calculate a complete financial result.
What a Six-Day Benchmark Reveals
An anonymized six-day comparison used real delivery data to compare existing operations with an optimized planning model.
Operational metric
Existing operation
Optimized planning result
Calculated change
Average missions per vehicle
18
21
16.7% higher
Average working time per vehicle
436 minutes
294 minutes
32.6% lower
Average distance per vehicle
56 km
44 km
21.4% lower
Vehicles used during the reporting period
64
55
14.1% fewer
*Percentages were calculated from the displayed benchmark values and rounded to one decimal place.*
The comparison shows why managers should review several measures together.
The model allocated more missions per vehicle while using fewer vehicles and showing lower average time and distance per vehicle.
These results suggest a planning opportunity, but they do not provide enough information to calculate an actual cost per delivery.
The dataset does not include:
Actual labour rates
Fuel or per-kilometre costs
Owned and hired vehicle costs
Completed versus failed mission totals
Planning and administration cost
Implementation expenses
Customer-service outcomes
*Benchmark note: This is an anonymized historical planning comparison, not an Australian case study or audited post-deployment saving. Australian results will depend on local costs, geography, fleet composition, delivery density and implementation.*
The correct lesson is not that cost per delivery fell by a particular percentage. It is that the operational inputs moved in ways that could be valued using the business’s own financial data.
Route Metrics Explain Travel and Workload
Route metrics help managers understand how delivery work was structured.
Total distance
Total kilometres indicate the scale of vehicle movement across the reporting period.
Distance should be reviewed with completed deliveries. A low-distance day is not efficient if important missions remain unassigned.
Kilometres per completed delivery
This metric adjusts distance for output.
It is more useful than total distance when delivery volume changes between days.
Planned route duration
Planned duration shows the workload the dispatch team expected each route to contain.
It should include travel and recorded service duration, not distance alone.
Actual route duration
Comparing planned and actual duration can reveal inaccurate service times, waiting, access problems or unrealistic workloads.
Stops or missions per route
This helps managers evaluate workload density.
A high number is not automatically better. The route still needs to fit vehicle capacity, customer windows and working hours.
Unassigned missions
Unassigned work reveals when available resources and constraints cannot accommodate the demand.
Excluding those missions from a productivity report without explanation can make performance appear stronger than it was.
Route optimization software helps evaluate distance, duration, fleet constraints and unassigned exceptions within the same planning process.
Driver Metrics Need Operational Context
Driver measures should support improvement, not create simplistic rankings.
Useful metrics include:
Completed missions per working hour
Driver minutes per completed mission
Planned versus actual route duration
Successful and unsuccessful mission counts
Route completion within the planned window
Status-update completeness
Delivery exceptions
Reassignments during the day
A driver covering a dense commercial area may complete fewer kilometres but spend more time at customer locations. A regional driver may travel much farther while completing fewer stops.
These differences do not automatically indicate better or worse performance.
Driver metrics should be segmented by route type, service requirements, delivery density and vehicle.
The driver mobile app keeps assigned routes, mission status and completion actions connected to field execution, providing stronger operational context than a mileage figure alone.
Fleet Metrics Show Resource Efficiency
Fleet metrics explain how vehicles and capacity contribute to cost per delivery.
Vehicles used
This measure helps managers understand the resources required for the reporting period.
Using fewer vehicles may reduce contractor or overflow costs. In an owned fleet, it may initially create spare capacity rather than immediate cash savings.
Missions per vehicle
The benchmark increased average missions per vehicle from 18 to 21.
This can indicate improved allocation, but it should be reviewed with route hours, distance, capacity and completion outcomes.
Capacity utilization
Weight, volume and item utilization help reveal whether routes are using available vehicle capacity effectively.
Very high utilization may leave too little operating buffer. Low utilization may be appropriate where vehicle skills, customer access or regional geography limit consolidation.
Average vehicle distance helps managers identify whether fleet workload is becoming more or less travel-intensive.
Vehicle cost per route
Combining owned, leased, hired or contractor vehicle costs with route activity helps expose differences that vehicle count alone cannot show.
Working-Time Metrics Connect Drivers and Fleet
Time is often one of the largest contributors to delivery cost.
Useful measures include:
Total planned route hours
Total actual route hours
Average working time per vehicle
Driver hours per completed delivery
Overtime exposure
Waiting time
Service time per stop
Routes finishing outside their planned window
In the six-day benchmark, average working time per vehicle changed from 436 minutes to 294 minutes in the modelled result.
That is operationally significant, but the financial value depends on how labour is paid and whether the reduced time changes scheduled, overtime or contractor cost.
Customer Metrics Connect Operations With Commercial Outcomes
Customer satisfaction should not be inferred from route distance alone.
Relevant measures can include:
On-time delivery performance
Failed-delivery rate
Redelivery rate
Delivery-related support contacts
Complaints per completed delivery
Disputes about completion
Customer retention by service segment
Delivery-related refunds or service recovery
Operational reports can identify the route and mission conditions surrounding a problem. Customer-service and commercial systems provide the downstream outcome.
This distinction matters when discussing sales and marketing costs.
More reliable deliveries may reduce complaint handling and retention pressure, but route data alone cannot prove lower customer-acquisition or sales costs. Those effects require connected customer and financial evidence.
Planned and Actual Metrics Should Remain Separate
Planned data explains the decision made before dispatch.
Actual data explains what happened during execution.
Both are valuable, but they should not be mixed without clear labels.
Planned measure
Actual measure
Question
Planned distance
Recorded or completed distance
Did the route follow the expected structure?
Planned duration
Actual route duration
Were travel and service assumptions realistic?
Planned missions
Completed missions
Was the assigned workload completed?
Planned vehicle
Vehicle actually used
Did a late assignment change affect the route?
Planned capacity
Actual loaded quantity
Was mission or vehicle data accurate?
Planned completion
Final mission status
Which work became an exception?
The difference between planned and actual results is often more informative than either number alone.
Segment Metrics Before Comparing Performance
A single fleet-wide average can hide important variation.
Australian delivery managers may need to segment results by:
Depot or branch
Metropolitan, outer-suburban or regional route
Vehicle type
Driver
Customer type
Service level
Delivery day
Route objective
Standard versus urgent work
Pickup, delivery or linked mission type
A regional route should not be expected to match the stop density of a metropolitan route. A specialized vehicle should not be judged against the utilization of a general-purpose van without context.
Segmentation turns averages into useful operational comparisons.
Fixed and Variable Costs Behave Differently
Not every cost changes when a route becomes shorter.
Variable costs can respond relatively quickly to route activity. Examples may include fuel, some contractor charges and distance-related maintenance exposure.
Fixed or semi-fixed costs may change more slowly. An owned vehicle, salaried driver or depot may still cost the same during a lower-volume week.
This creates an important distinction:
**Operational efficiency:** using fewer kilometres, hours or vehicles to complete the work
**Realized financial saving:** an expense actually decreases or future expenditure is avoided
A route plan can improve operational efficiency before the full financial benefit appears.
Managers should document both.
Avoid Common Reporting Mistakes
Measuring cost per dispatched mission
This can reward activity even when deliveries fail. Use completed deliveries or report attempts and completions separately.
Tracking distance without completion
Fewer kilometres are not helpful if more missions remain unassigned or require redelivery.
Treating all routes as comparable
Different geography, service duration and customer requirements can make direct driver comparisons unfair.
Mixing fixed and variable costs
A lower daily vehicle requirement does not automatically remove an owned vehicle cost.
Using averages without distributions
An acceptable average can hide several extremely long or overloaded routes.
Reporting too many metrics
A dashboard with dozens of measures can make decisions harder. Each metric should have an owner and a possible action.
Changing definitions between periods
If “completed delivery” or included costs change, the trend becomes unreliable.
Build a Small Delivery-Metrics Scorecard
A practical management scorecard can begin with:
Management outcome
Supporting metrics
Cost control
Cost per completed delivery, distance and driver time
Route efficiency
Kilometres per completed mission and planned versus actual duration
Fleet efficiency
Vehicles used, missions per vehicle and capacity utilization
Driver workflow
Completed missions per hour and exception rate
Service reliability
Completion, failure and redelivery rates
Planning quality
Planning time, manual edits and unassigned missions
Additional metrics should be added only when they help answer a recurring business question.
Use Different Review Cadences
Not every metric needs to be reviewed at the same frequency.
A useful metric should suggest what to investigate next.
Metric movement
Possible investigation
Distance per delivery increases
Route grouping, depot allocation or delivery density
Driver time increases
Service duration, waiting, workload or route sequence
Missions per vehicle decreases
Capacity allocation, fleet selection or lower demand
Vehicle count increases
Working windows, unassigned work or route overlap
Failure rate increases
Time windows, mission data or driver context
Manual edits increase
Input quality, planning constraints or dispatcher requirements
Cost per delivery increases
Separate volume, labour, distance, fleet and failure effects
The metric does not make the decision. It directs the manager toward the part of the operation that needs attention.
Build a Continuous Improvement Loop
The strongest delivery teams use metrics as part of a repeated cycle:
Define consistent metrics and cost categories.
Establish a representative baseline.
Plan routes using current mission and fleet data.
Review and dispatch the plan.
Record actual completion and exceptions.
Combine operational and financial results.
Identify the cause of material changes.
Revise data, constraints or operating decisions.
Measure the next cycle using the same definitions.
Over time, this process builds an operational history that competitors cannot reproduce quickly.
Measure the Outcome, Then Find the Cause
Cost per delivery gives managers one clear outcome.
Route, driver, fleet, mission and planning metrics explain how the operation produced it.
When these measures use consistent definitions and stay close to real delivery activity, Australian delivery teams can move from reporting what happened to deciding what should change next.
Results-oriented and visionary CEO with a passion for innovation and a track record of transforming startups into industry leaders. Seeking a leadership role in a dynamic startup environment where I can leverage my strategic acumen, entrepreneurial spirit, and hands-on experience to drive growth, build high-performing teams, and deliver unparalleled value to customers. Committed to fostering a culture of creativity, adaptability, and sustainable success.
It is the delivery operation’s relevant cost divided by the number of completed deliveries during the same period. The included costs and completion definition should remain consistent.
Should failed deliveries be included?
Failed attempts should be measured, but they should not normally be counted as completed deliveries. Their cost can be included in total operating cost and reported separately.
Which route metrics matter most?
Distance per completed delivery, planned and actual route duration, route workload, unassigned missions and completion performance provide a useful starting point.
How should driver performance be measured?
Use completed work, time, route conditions and exceptions together. Avoid ranking drivers using distance or stop count without considering geography and service requirements.
What fleet metrics affect cost per delivery?
Vehicles used, missions per vehicle, capacity utilization, vehicle cost, distance and working time can all affect the result.
Can Rouptimize calculate every financial metric?
Rouptimize provides operational route, mission, driver and fleet data. A complete cost-per-delivery calculation may also require labour, fuel, contractor, vehicle and finance data from the business.
Can better delivery metrics reduce costs?
They can help managers identify where avoidable cost is created and evaluate whether changes are working. Measurement alone does not reduce cost; the operational decisions made from it do.
 Mohammad AlavitabarCEO @ Rouptimize