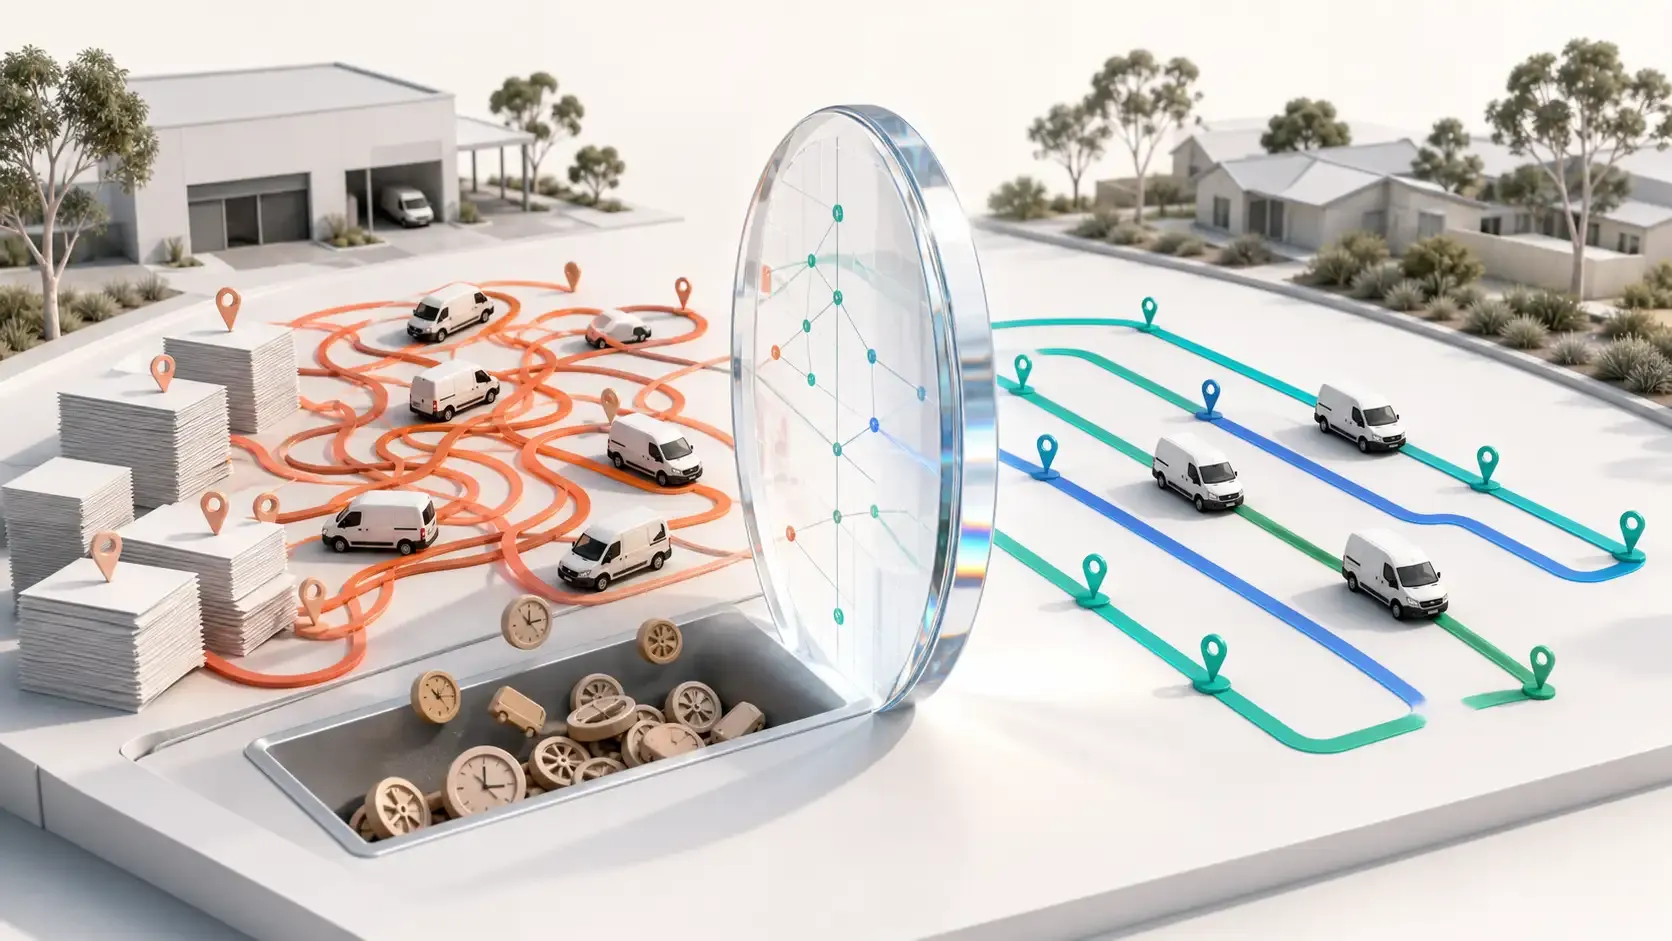
The Real Cost of Manual Route Planning for Australian Delivery Operations
The cost of manual route planning extends beyond the dispatcher’s planning time. Excess distance, repeated work, additional vehicles and hidden delivery exceptions can all affect the final cost per completed delivery.
The operation already has spreadsheets, maps, phones and an experienced dispatcher. There may be no obvious software cost, and the routes usually leave the depot somehow.
But the real cost of manual route planning is distributed across the delivery operation.
The Cost of Manual Route Planning in Australia | Rouptimize
It can appear as planning hours, duplicated kilometres, additional vehicles, late route changes, driver questions, failed deliveries and reports that take too long to produce.
For Australian delivery teams, the important comparison is not software cost versus no software cost. It is the cost of a connected planning workflow compared with the complete cost of producing, dispatching and correcting routes manually.
Manual Planning Cost Is More Than Planner Time
The dispatcher’s time is the most visible cost, but it is only the beginning.
Cost area
How manual planning can affect it
Planning labour
Orders, maps, vehicles and constraints are checked manually
Driver time
Routes may contain avoidable travel, waiting or workload imbalance
Distance
Nearby work may be split between routes or routes may overlap
Vehicle use
Additional vehicles may be used because capacity is allocated poorly
Administration
Assignments and changes are recreated across several tools
Dispatch delays
Problems are discovered during loading or immediately before departure
Failed delivery work
Time windows, capacity or mission details may be missed
Customer service
Delivery exceptions create additional calls and follow-up
Reporting
Planned and completed data must be reconciled manually
Knowledge risk
Important routing rules remain in one dispatcher’s memory
A manual route can be completed successfully while still costing more than necessary.
The difficulty is that these costs rarely appear in one account or report.
What a Six-Day Operational Benchmark Shows
An anonymized six-day comparison used real delivery data to evaluate existing operations against an optimized planning model.
Metric
Existing operation
Optimized planning result
Calculated change
Average missions per vehicle
18
21
16.7% higher
Average working time per vehicle
436 minutes
294 minutes
32.6% lower
Average distance per vehicle
56 km
44 km
21.4% lower
Vehicles used during the reporting period
64
55
14.1% fewer
*Percentages were calculated from the displayed benchmark values and rounded to one decimal place.*
The value of this comparison is not one isolated percentage.
The model allocated more missions per vehicle while showing lower average distance, lower average working time and fewer vehicles across the reviewed period.
These measures moved together because mission allocation, route sequence and fleet use were evaluated as one planning problem.
*Benchmark note: This is anonymized historical operational data, not an Australian customer case study or audited post-deployment saving. The optimized values represent a planning model. Australian results will depend on delivery density, service duration, traffic, fleet mix, labour costs and data quality.*
A Larger Dataset Shows the Scale of Hidden Distance
A separate historical dataset compared distance in existing route records with a modelled route plan created from real operational data.
Distance measure
Recorded result
Distance in existing route records
152,282 km
Distance in the modelled plan
85,714 km
Difference
66,568 km
Calculated difference
43.7% lower
Reduction stated in the source report
43%
The difference is substantial, but it needs to be interpreted correctly.
It does not prove that 66,568 kilometres were removed from a live Australian operation. It compares existing route records with a modelled alternative.
It also does not establish an equivalent percentage reduction in fuel, labour or total delivery cost.
The dataset demonstrates the amount of distance that route structure and mission allocation can influence. Converting that planning opportunity into financial savings requires implementation, operational adoption and measurement.
Where Manual Routes Accumulate Extra Kilometres
Excess distance is not always caused by one obviously poor route.
It can accumulate through small daily decisions:
Nearby customers are assigned to different drivers
Routes cross or overlap
A driver returns through an area served earlier by another route
Mission priority is handled without reviewing the wider plan
Vehicle capacity forces late route splitting
A customer is assigned from an unsuitable depot
New work is added to whichever driver appears available
Unassigned missions are inserted after routes are already finalized
Each decision may add only a few kilometres. Repeated across vehicles, days and depots, the total can become significant.
Route optimization software evaluates mission grouping and stop sequence across the selected fleet rather than building each route as a separate manual decision.
They compare addresses, delivery priorities, vehicle capacities, customer windows, driver availability and local conditions. They also respond to changes while the delivery day is approaching.
That work requires concentration and operational knowledge.
The cost is not simply the number of minutes spent moving stops on a map. It includes the work the dispatcher cannot perform while building routes manually, such as:
Reviewing recurring delivery failures
Improving customer data
Supporting active drivers
Analyzing route performance
Preparing for future volume
Training other team members
Investigating fleet utilization
Improving dispatch processes
Automation is valuable when it redirects expert attention from repeated calculation to review and improvement.
Manual Planning Becomes Harder as Constraints Increase
A dispatcher may be able to plan a small number of stable routes effectively from experience.
Complexity grows quickly when the operation adds:
More missions
More vehicles
Several vehicle sizes
Weight or volume constraints
Customer time windows
Different service durations
Multiple depots
Driver or vehicle skills
Pickup and delivery relationships
Date-specific availability
Same-day changes
The number of possible combinations becomes difficult to compare manually.
The issue is not that the dispatcher lacks expertise. The problem is that the human planning process has limited time in which to evaluate alternatives.
Vehicle Capacity Creates Hidden Rework
Manual maps rarely show whether the assigned deliveries fit inside each vehicle.
A dispatcher may calculate capacity separately or rely on experience. If mission quantities change or vehicle records are incomplete, the issue may remain hidden until loading.
Capacity-related corrections can require:
Moving missions between routes
Reassigning vehicles
Changing drivers
Adding an overflow vehicle
Reordering stops
Informing affected customers
Producing new route instructions
Accurate fleet capacity data allows item, weight and volume limits to influence the plan before dispatch.
The earlier a capacity problem becomes visible, the more options the operation has for resolving it.
Working Hours Change the Number of Feasible Routes
A manually planned route may appear reasonable until its complete duration is calculated.
Travel time is only part of the working day. Loading, customer access, waiting, service activity and return travel also consume time.
If one route exceeds the valid vehicle or driver window, work may need to move to another route or vehicle.
Ignoring working windows can create overtime exposure, incomplete work and late-day dispatch intervention.
Disconnected Tools Multiply the Administration
Manual route planning often involves more than one tool.
Orders may begin in a spreadsheet. Vehicle availability may sit in a fleet system. Routes may be drawn in a consumer mapping product. Assignments may be sent through messaging applications. Completion data may return in another spreadsheet.
The same information is entered or interpreted several times.
A route change made during planning may take seconds.
The same change made after vehicles are loaded can affect:
Cargo placement
Driver assignments
Vehicle departure
Route sequence
Customer expectations
Delivery documentation
Other routes receiving transferred work
Manual planning often hides exceptions until the operation reaches loading or dispatch.
Route optimization does not remove exceptions. It can make capacity, availability, time-window and assignment problems visible while the plan is still being reviewed.
Additional Vehicles Are Not Always Additional Capacity
When a manual plan does not fit, adding another vehicle may appear to be the fastest solution.
But the fleet may already contain usable capacity distributed poorly across existing routes.
The six-day benchmark model used 55 vehicles rather than 64 while increasing average missions per vehicle. That does not mean every fleet can remove 14.1% of its vehicles.
It shows why managers should investigate whether additional vehicle use is caused by:
Genuine demand
Capacity constraints
Working-hour limits
Poor mission grouping
Route overlap
Depot allocation
Missing planning data
For owned vehicles, a lower daily requirement may create spare capacity rather than immediate cash savings. For contracted or overflow vehicles, the financial effect may be more direct.
Manual Planning Can Hide Unassigned Work
A dispatcher may focus on the routes that have been built while unresolved missions remain in another list or spreadsheet.
This makes it difficult to answer:
Has every mission been allocated?
Which work could not fit?
Why was it left unassigned?
Does the problem relate to capacity, time or skills?
Is another vehicle genuinely required?
Should the customer promise be revised?
An optimizer should show unassigned work as an exception.
Visibility does not solve the problem automatically, but it gives dispatchers time to correct data, add a resource, change the plan or communicate a realistic delivery decision.
Customer Costs Begin With Operational Problems
Manual route planning data can support conclusions about distance, time, vehicles and productivity.
It does not directly prove reductions in marketing or sales costs.
Those commercial effects should be explained and measured through a separate chain:
An impractical route creates a late or failed delivery.
The customer contacts support or an account manager.
The operation schedules redelivery or provides another resolution.
Repeated failures reduce confidence and may affect retention.
Sales and marketing face greater pressure to replace dissatisfied customers.
Better routing may reduce the operational causes of some complaints. To demonstrate commercial impact, the business should connect route data with customer-service contacts, redelivery records, retention and sales information.
The relationship is credible, but it should not be presented as an automatic saving.
The Cost of Depending on One Routing Expert
Manual planning often works because one experienced person understands the operation exceptionally well.
That dispatcher may know:
Which customers take longer than recorded
Which vehicles suit particular locations
Which drivers understand certain areas
Which roads or entrances create problems
How much work can fit into a real shift
Which route changes are likely to fail
This knowledge is valuable. It is also difficult to recruit, replace and scale.
Software does not eliminate the need for an expert dispatcher. It reduces dependence on that person performing every calculation manually and makes the result easier for other team members to review.
When Manual Route Planning May Still Be Reasonable
Manual planning is not automatically wrong.
It may remain practical when:
Delivery volume is very low
Routes rarely change
Vehicles are nearly identical
Customers have few time constraints
One driver serves one stable area
Planning takes little time
Performance is already measured reliably
The cost of mistakes is limited
The decision changes as volume, variation and operational constraints increase.
A useful question is not, “Can we still create routes manually?”
It is, “What does creating, checking, dispatching and correcting those routes cost us now?”
Signs That Manual Planning Has Reached Its Limit
Australian delivery teams should examine their planning process when:
Route building consumes a large part of the dispatcher’s day
Routes are rebuilt in several tools
Departure waits for one planner to finish
Vehicle capacity problems appear during loading
Drivers regularly question assignments
Routes cross or duplicate the same area
Additional vehicles are added without a clear analysis
Customer time windows are frequently missed
Reports require extensive spreadsheet cleanup
The same operational problems repeat
Only one person can produce the daily plan
One sign alone may not justify a platform change. A recurring pattern usually deserves measurement.
How to Calculate the Cost of Manual Planning
A useful baseline should include more than software subscription comparisons.
Cost category
Baseline information to collect
Planning labour
Hours spent importing, planning, checking and communicating routes
Driver labour
Planned and actual route hours, including overtime exposure
Distance
Total kilometres and kilometres per completed mission
Vehicle use
Owned, hired, contractor and overflow vehicles used
Administration
Time spent correcting data, assignments and reports
Failed work
Unsuccessful, rescheduled and repeated deliveries
Customer service
Delivery-related contacts and handling time
Knowledge risk
Time required to train or replace the primary planner
The baseline should be collected across representative delivery days rather than one unusually good or bad day.
A route optimization pilot can then compare equivalent data using the same operational definitions.
A Better Route-Planning Workflow
A connected planning process can follow these steps:
Import or create delivery missions.
Validate locations, quantities, service durations and time windows.
Confirm active vehicles, drivers, capacities and working windows.
Select the relevant depots and planning date.
Generate routes using the recorded constraints.
Compare distance, duration, vehicle count and unassigned work.
Results-oriented and visionary CEO with a passion for innovation and a track record of transforming startups into industry leaders. Seeking a leadership role in a dynamic startup environment where I can leverage my strategic acumen, entrepreneurial spirit, and hands-on experience to drive growth, build high-performing teams, and deliver unparalleled value to customers. Committed to fostering a culture of creativity, adaptability, and sustainable success.
They include planning labour, excess distance, driver time, additional vehicle use, route corrections, dispatch delays, failed deliveries and manual reporting.
Is manual route planning free?
No. Even without software fees, the business pays for the people, vehicles, distance and rework involved in creating and correcting the plan.
Can route optimization reduce delivery distance?
It can identify lower-distance alternatives while considering the constraints supplied. Actual reductions depend on the existing operation, data quality and route objectives.
Does route optimization always reduce fleet size?
No. It may reveal opportunities to use fewer vehicles, but genuine fleet requirements depend on capacity, working hours, service commitments and demand.
Will route optimization replace dispatchers?
No. It automates calculations and applies structured constraints. Dispatchers still review routes, add local knowledge and manage exceptions.
How should an Australian business evaluate route optimization software?
Use representative delivery data and compare planning time, vehicles, hours, kilometres, unassigned work and completion performance against a documented baseline.
Can better routes reduce marketing and sales costs?
Potentially, through improved delivery reliability and customer retention. However, operational route data alone does not prove that outcome. Customer-service, retention and sales data should be measured separately.
 Mohammad AlavitabarCEO @ Rouptimize