Delivery Operations Dashboards: Turning Route Data Into Better Management Decisions
A practical guide to using route, mission, driver and fleet data to identify operational problems, test improvements and make better delivery decisions over time.
 Mohammad AlavitabarCEO @ Rouptimize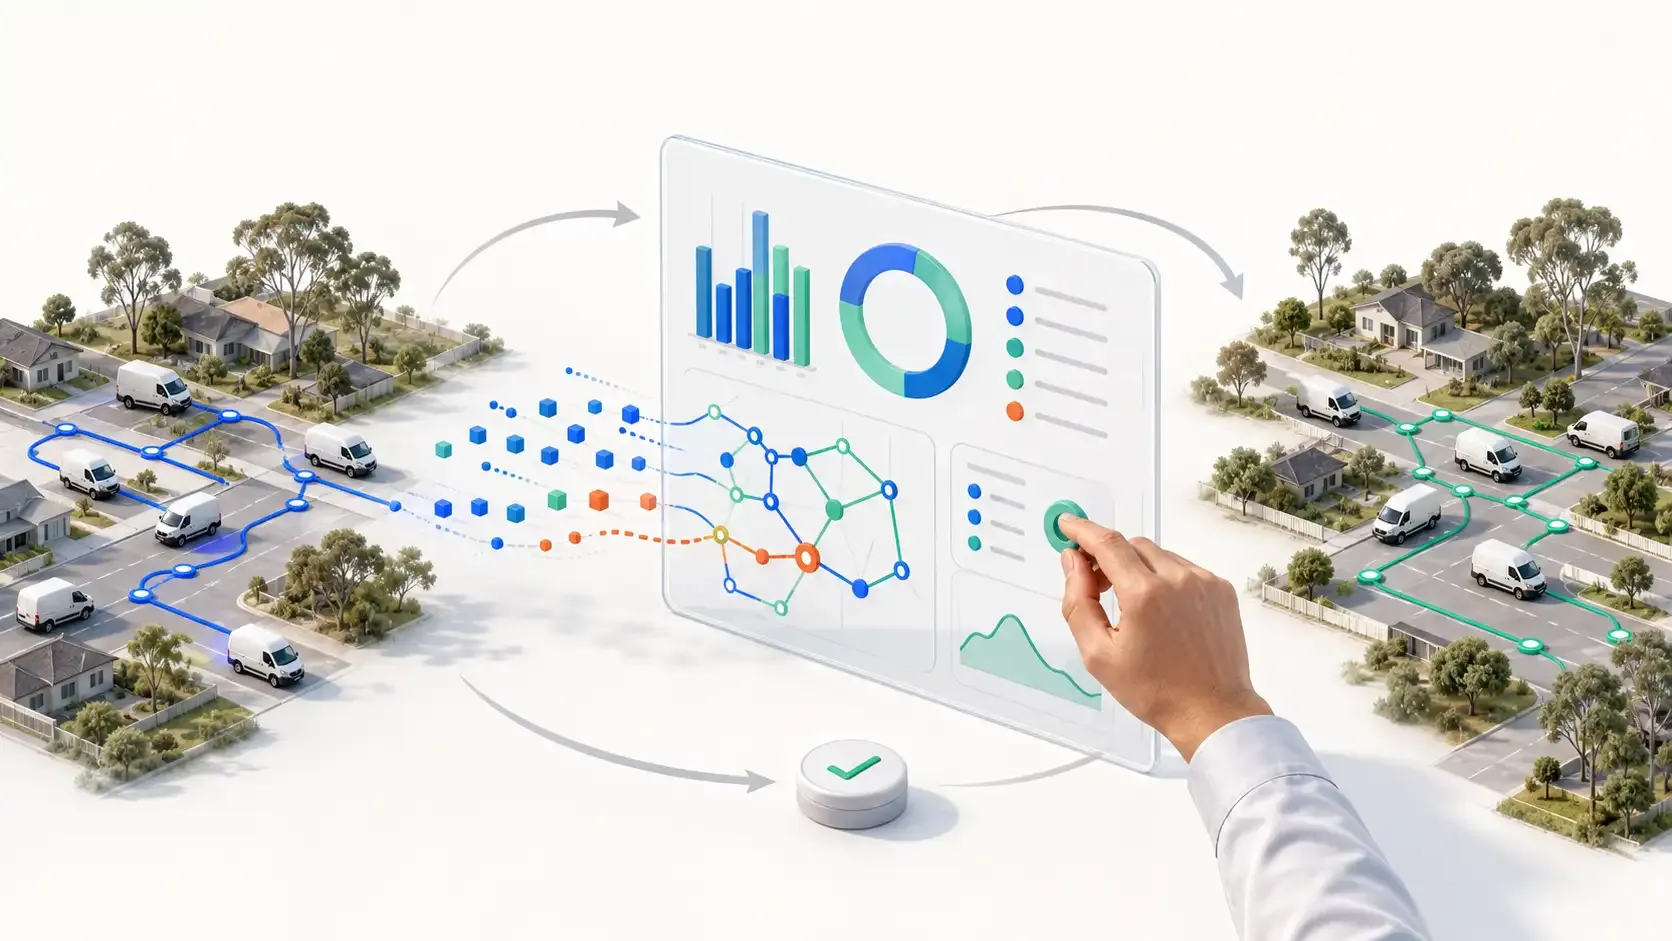
On this page
A delivery operations dashboard should do more than display attractive charts.
Its real purpose is to help managers understand what happened, identify why it happened and decide what should change before the next dispatch cycle.
For Australian delivery teams managing metropolitan routes, regional runs, multiple depots or a growing driver network, this connection between operational data and management decisions becomes increasingly valuable. Without it, route information may be collected every day but rarely turned into consistent improvement.
The strongest delivery dashboards connect missions, routes, drivers, vehicles, completion records and exceptions in one operational picture. They give managers enough context to act without spending hours rebuilding reports in spreadsheets.
What Is a Delivery Operations Dashboard?
A delivery operations dashboard brings together information created throughout the delivery workflow.
That information may include:
- Planned and completed missions
- Active and completed routes
- Route distance and duration
- Driver activity
- Vehicle assignments
- Fleet utilisation
- Delivery success rates
- Proof-of-delivery status
- Operational exceptions
These figures are useful individually, but their real value comes from examining how they relate to one another.
For example, a longer route duration does not automatically indicate poor driver performance. The route may have included more stops, longer service durations, difficult time windows or a larger geographic area.
A useful dashboard keeps this context close to the metric.
The Data Behind Better Delivery Decisions
Reliable reporting begins before a route is dispatched.
Mission addresses, service durations, time windows, priorities, capacities and required skills all influence the resulting plan. Incomplete or inconsistent inputs make it difficult to interpret performance later.
This is why clean delivery mission data is not only a planning concern. It is also the foundation of trustworthy reporting.
A connected delivery data flow usually follows this sequence:
- Missions are created or imported.
- Routes are generated and reviewed.
- Drivers and vehicles are assigned.
- Drivers complete delivery work.
- Status and proof information are recorded.
- Route performance is reviewed.
- Management decisions are applied to future plans.
When these stages happen in separate tools, managers may need to reconcile different route names, driver records and completion statuses before analysis can begin.
Keeping them connected makes it easier to move from evidence to action.
Five Questions a Delivery Dashboard Should Answer
1. How Much Work Was Planned and Completed?
Managers need a clear view of delivery volume.
This includes the number of planned missions, completed missions, active routes and unsuccessful or unresolved stops. The purpose is not simply to produce a total. It is to understand whether planned work moved through the operation as expected.
A falling completion rate may point to unrealistic route plans, incorrect addresses, customer availability problems or operational exceptions. The dashboard should help managers investigate these possibilities instead of treating every unsuccessful delivery as the same problem.
2. Which Routes Performed Differently From the Plan?
Planned distance and duration create a useful reference point for reviewing execution.
When a route repeatedly takes longer than expected, managers can examine:
- Stop service durations
- Time-window pressure
- Route sequencing
- Mission density
- Driver and vehicle assignments
- Depot selection
- Repeated operational delays
One unusual day may not justify a process change. A repeated pattern across comparable routes deserves closer attention.
This is where route optimization and reporting should work together. Reporting identifies where plans require improvement, while the next planning cycle provides an opportunity to test that improvement.
3. How Are Drivers Performing in Context?
Driver performance reports should support coaching and operational improvement, not simplistic ranking.
Distance, route duration and completed missions can help managers understand activity, but these measures must be considered alongside route difficulty.
A driver completing a compact metropolitan route should not be compared directly with someone covering a long regional area. Likewise, a route containing strict time windows or high service durations may require more time even when it is performed well.
Managers can use a structured process to review driver performance while retaining the route and mission context behind each result.
4. Is the Fleet Being Used Appropriately?
A fleet utilisation dashboard can help teams understand whether available vehicles are being matched effectively with daily work.
Useful questions include:
- Are some vehicles consistently underused?
- Are particular vehicle types assigned to unsuitable work?
- Is delivery volume distributed appropriately across the available fleet?
- Are inactive or unavailable vehicles still influencing planning?
- Are capacity limits creating unnecessary route pressure?
The objective is not to keep every vehicle moving at all times. It is to make assignments that suit mission requirements, capacity, working hours and branch conditions.
Accurate vehicle records within fleet management make these comparisons more meaningful.
5. Which Exceptions Keep Appearing?
Recurring exceptions often reveal more than general averages.
A delivery team may notice repeated problems involving:
- Incorrect customer details
- Unsuccessful confirmation attempts
- Unrealistic service durations
- Missions assigned to the wrong branch
- Capacity mismatches
- Frequent manual route changes
- Stops regularly completed outside the expected sequence
A connected proof-of-delivery workflow can also help managers distinguish between planned completion, driver status and verified delivery confirmation.
Instead of treating each exception as an isolated event, the team can look for patterns and address the underlying process.
Live Monitoring and Dashboards Serve Different Purposes
Live monitoring helps dispatchers understand what is happening now.
It can support immediate decisions when an active route changes, a driver requires assistance or a delivery exception appears. Historical reports serve a different purpose: they help managers compare results and improve future operations.
A practical operating model uses both:
- Live monitoring supports intervention during the current delivery day.
- Reports and dashboards support improvement across future delivery days.
Teams that want visibility without creating unnecessary pressure on field staff can use a live monitoring approach that avoids micromanaging drivers.
Choosing Delivery Metrics That Lead to Action
A metric is valuable when it can influence a decision.
For most delivery operations, useful measures include:
- Mission completion and success rate
- Active and completed route counts
- Route distance
- Route duration
- Driver activity
- Fleet utilisation
- Delivery and mission history
- Proof and exception status
Before adding a metric to a regular management review, ask three questions:
- What operational question does this metric answer?
- Who is responsible for reviewing it?
- What decision could change because of it?
If nobody can explain what action a metric supports, it may be a vanity measure rather than a management tool.
For a broader framework, review these delivery performance metrics.
Reporting Across Australian Delivery Operations
Australian delivery networks can contain very different operating environments.
A business may manage dense inner-city routes, outer-suburban deliveries, regional runs or separate operations across multiple branches. Comparing all of these routes as though they are identical can create misleading conclusions.
Managers should group performance data by relevant operational context, such as:
- Branch or depot
- Metropolitan or regional route
- Delivery type
- Vehicle type
- Mission volume
- Route distance
- Time-window requirements
- Day of the week
This creates fairer comparisons and helps teams identify whether a problem belongs to one route, one branch or the wider delivery process.
Build a Repeatable Management Review
Dashboards become more useful when they are connected to a regular review rhythm.
Daily Review
Focus on immediate operational outcomes:
- Unfinished missions
- Route exceptions
- Proof issues
- Major differences from the plan
- Problems that could affect the next dispatch
Weekly Review
Look for repeated patterns:
- Routes that regularly exceed expected duration
- Drivers or branches requiring additional support
- Repeated manual route changes
- Changes in delivery success
- Vehicle utilisation imbalances
Monthly Review
Consider broader operational decisions:
- Fleet requirements
- Branch and depot performance
- Customer service policies
- Planning assumptions
- Data-quality improvements
- Changes to driver or dispatcher workflows
The frequency matters less than consistency. A short review that leads to documented action is more useful than an extensive report that nobody revisits.
Turn Reporting Into a Continuous Improvement Loop
The most valuable delivery reporting process is not linear. It is a loop:
- Collect operational data.
- Compare planned and completed work.
- Investigate meaningful differences.
- Decide what should change.
- Apply the change to future routes.
- Review the result.
- Retain, revise or replace the decision.
For example, a manager may notice that one group of routes repeatedly exceeds its planned duration. The team reviews the missions and finds that service durations are too low. Those durations are updated before the next planning cycle.
The following week, the team checks whether planned and actual performance are closer. If the problem continues, it investigates another factor.
This process does not depend on making every decision perfectly the first time. It depends on learning from each dispatch cycle.
Over months and years, that discipline can create an operational advantage that is difficult for competitors to copy. The advantage is not simply having more data. It is having a culture that uses data to make, review and improve decisions.
Common Dashboard Mistakes
Ranking Drivers With One Metric
A single figure rarely explains driver performance. Route complexity, mission volume, geography and customer requirements should remain visible.
Comparing Unlike Routes
A regional route and an inner-city route may have completely different operating conditions. Comparisons should use relevant groups.
Reacting to One Difficult Day
Weather, customer availability, road conditions and unexpected events can distort short-term results. Look for recurring patterns before redesigning the operation.
Ignoring Input Quality
A dashboard cannot correct unreliable mission, route or vehicle data. Data-quality issues should be addressed at their source.
Reviewing Reports Without Assigning Action
Every important finding should have an owner, a proposed response and a future review date.
How Rouptimize Connects Route Data and Reporting
Rouptimize keeps mission, route, driver and fleet activity within a connected delivery workflow.
Teams can use reports and analytics to review delivery activity, active routes, driver performance, mission history, distance, duration, success rate and fleet utilisation after route work is active or completed.
Managers can then use those findings when adjusting mission data, vehicle constraints, route plans and dispatch decisions.
The practical documentation for reading reports and dashboards provides the next step for teams already using the platform.
Make Every Dispatch Cycle More Informed
Delivery operations dashboards are most valuable when they connect reporting with action.
Collect reliable mission and route data. Review performance in context. Investigate recurring exceptions. Apply a measured change, and then use the next report to decide whether it worked.
This continuous review process helps Australian delivery teams build stronger operational knowledge over time.
For a wider view of how planning, reporting and driver workflows work together, read about reducing delivery costs in Australia.
When your team is ready to connect route planning, dispatch, driver activity and reporting, start with Rouptimize.
Written by
Results-oriented and visionary CEO with a passion for innovation and a track record of transforming startups into industry leaders. Seeking a leadership role in a dynamic startup environment where I can leverage my strategic acumen, entrepreneurial spirit, and hands-on experience to drive growth, build high-performing teams, and deliver unparalleled value to customers. Committed to fostering a culture of creativity, adaptability, and sustainable success.
Operations • Management • Route Optimization • Product Management • Logistics • Problem Solving
FAQ
What should a delivery operations dashboard include?
It should include metrics connected to missions, routes, drivers, vehicles, completion status and operational exceptions. The exact selection should reflect the decisions your team needs to make.
How often should delivery dashboards be reviewed?
Immediate exceptions may require daily attention, while performance patterns are often better reviewed weekly or monthly. Each review should have a defined purpose.
Can a dashboard identify why a route performed poorly?
A dashboard can highlight differences and recurring patterns, but managers still need to investigate the operational context. Mission details, route constraints, driver assignments and exceptions may all contribute.
Should delivery teams compare driver performance?
Driver performance can be reviewed, but comparisons should account for route distance, mission volume, geography, service duration and other operating conditions.
How can delivery dashboards help reduce costs?
Dashboards can reveal repeated route inefficiencies, unsuitable fleet assignments, failed deliveries and process problems. Acting on those findings may help control operational costs, but results depend on the quality of the data and decisions.