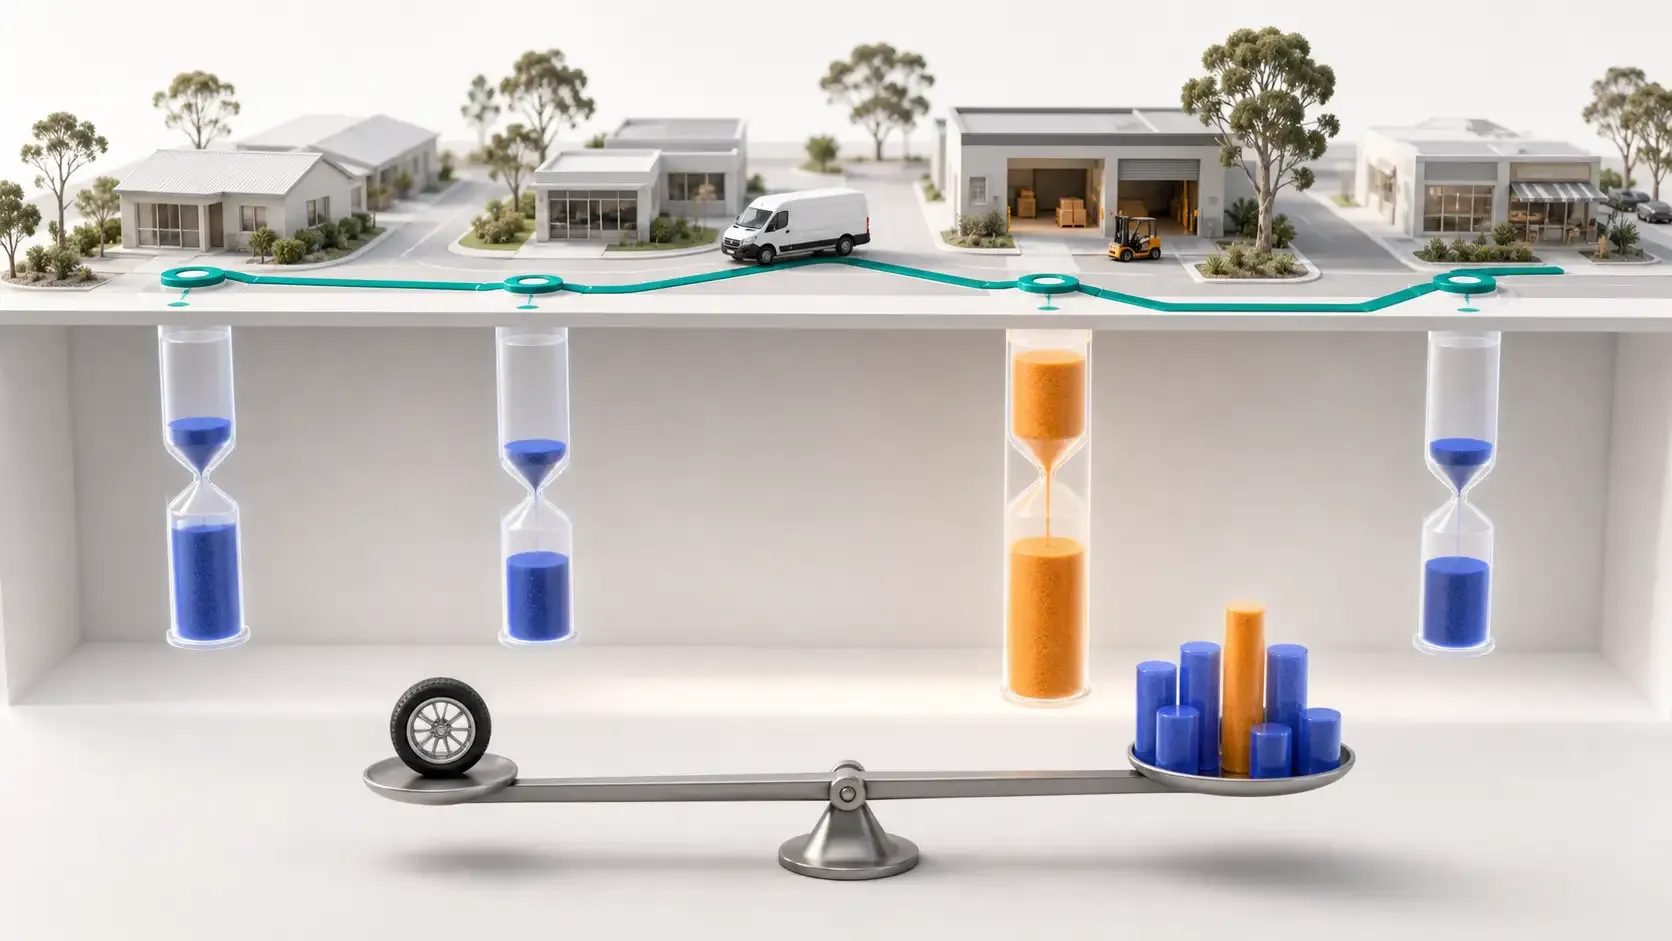
Service Time at the Customer: The Hidden Cost Inside Every Delivery Route
Short travel distances can hide hours of customer service activity. Accurate stop-duration data helps delivery teams create realistic routes, working windows and cost estimates.
A route containing nearby customers can look highly efficient.
The distances are short, the road sequence appears simple and the driver may remain within one delivery area.
But the route can still consume most of the working day.
At every stop, the driver may need to find the correct entrance, wait for access, unload goods, confirm quantities, complete a service task and record delivery completion.
Customer Service Time in Route Planning | Rouptimize
Those minutes accumulate.
For Australian delivery teams, accurate customer service time can be as important as travel time when calculating route duration, fleet requirements and delivery cost.
What Is Customer Service Time?
In delivery route planning, service time is the planned amount of time required at a stop after the vehicle arrives.
It may include:
Parking and site access
Locating the receiving point
Waiting for the customer or loading area
Unloading
Handling paperwork
Checking quantities
Completing a service activity
Obtaining delivery confirmation
Updating the mission status
Returning to the vehicle
Different operations may separate waiting, parking and service into individual measures. Others may represent them through one stop-duration value.
The important requirement is consistency.
Everyone using the data should understand when service time begins, when it ends and which activities it includes.
Route Duration Is More Than Travel Time
A practical route-duration estimate can include:
Route component
Example activity
Depot preparation
Vehicle checks and loading
Travel time
Driving from the depot and between stops
Customer service time
Access, unloading, completion and confirmation
Waiting time
Arriving before a customer can receive the delivery
Scheduled non-driving activity
Required operational pauses
Return time
Travelling back to the depot
End-of-route work
Reconciliation or final completion steps
If service duration is missing, the planner may treat the route as though drivers leave immediately after reaching each address.
That creates an unrealistic route even when the travel estimate is accurate.
A Small Error Multiplies Across the Route
Service-time errors become significant when multiplied by many stops.
Suppose a route contains 30 missions and the planned service duration is five minutes lower than the real average.
The route may be underestimated by 150 minutes.
That difference can affect:
Driver working hours
Customer ETAs
Later time windows
Vehicle return time
Route workload
Overtime exposure
The number of vehicles required
Missions completed
The problem is rarely one five-minute difference. It is the same difference repeated across the route.
What Historical Operational Data Indicates
One reviewed historical operational report stated that delivery service activity represented more than 75% of total reported time in that particular operation.
That finding should be interpreted cautiously.
It does not mean service time represents more than 75% of every delivery route. The result belongs to one anonymized dataset, using the report’s own activity definitions and operating conditions.
It does demonstrate why delivery managers should not assume that driving is always the largest source of route time.
Reported finding
Appropriate interpretation
Service activity represented more than 75% of reviewed total time
Stop-level work was a major time component in that operation
Not an Australian dataset
The percentage should not be presented as an Australian benchmark
Dataset-specific definitions
Other businesses need to measure their own service activities
Historical operational evidence
Useful for identifying a planning question, not promising a result
The correct action is to measure service duration locally rather than copy the percentage.
Distance Alone Cannot Explain Operating Hours
A separate anonymized one-day route-planning analysis compared time-focused and distance-focused alternatives across four depots.
Planning scenario
Vehicles
Total operating hours
Total distance
Recorded baseline
55
530 hours
3,619 km
Time-focused plan
51
521 hours
3,201 km
Distance-focused plan
51
554 hours
2,939 km
The distance-focused plan travelled 262 fewer kilometres than the time-focused alternative but required 33 more operating hours.
The table does not isolate service time as the cause of that difference.
It shows that total hours cannot be explained by distance alone. Stop density, service duration, route sequence, waiting and workload distribution are among the operational inputs needed to understand the result.
*Benchmark note: This is an anonymized historical planning analysis using real operational data. The scenarios are modelled alternatives, not Australian implementations or audited financial outcomes.*
The source planning data also included customer groups, delivery windows and stop durations.
At this scale, a small recurring error in service duration can materially change total planned workload.
*Dataset note: These values come from anonymized historical operational data. Invoice, mission and customer counts represent different units and should not be treated as interchangeable. The data is not an Australian customer case study.*
Why Service Time Varies Between Customers
Using one default duration for every delivery is simple, but often inaccurate.
Service time can vary according to:
Customer type
Delivery quantity
Product characteristics
Vehicle type
Loading equipment
Parking availability
Building access
Security or check-in procedures
Receiving process
Documentation requirements
Time of day
Driver familiarity
Proof-of-delivery requirements
A residential delivery, retail store, warehouse and multi-level commercial building can create very different on-site workloads.
Australian operations serving a mix of metropolitan, outer-suburban and regional customers should avoid assuming that location proximity means service similarity.
Quantity and Service Time Are Related, but Not Perfectly
Larger deliveries may require more unloading time.
The relationship is not always linear.
Ten small parcels may take longer to process than one larger item. A bulk delivery may be unloaded quickly at a prepared dock, while a small order may require parking, access and customer confirmation.
Mission data can help managers understand whether service duration is influenced by:
Item count
Weight
Volume
Customer category
Vehicle type
Delivery method
Required confirmation
Special handling
Rouptimize’s mission management workflow keeps service duration, quantities, locations, time windows and priorities attached to the delivery work.
Missing Service Time Can Make a Route Look Better Than It Is
An incomplete route model may produce:
More missions per vehicle
Shorter planned route duration
Fewer vehicles
More customer windows appearing achievable
Lower estimated labour cost
Those results can look attractive.
If service activity has not been represented, however, the model is comparing incomplete workloads.
The problem becomes visible during execution through:
Late stops
Missed windows
Driver overtime
Incomplete routes
Mission reassignment
Customer contact
Redelivery work
A credible route plan should include the work that happens after arrival.
Overstated Service Time Also Creates Cost
Underestimation is not the only problem.
If every stop contains an unnecessarily large duration, the planning system may:
Build too many routes
Use additional vehicles
Leave feasible missions unassigned
Under-use available working hours
Produce unnecessarily early ETAs
Reduce vehicle utilization
Service-time data should be realistic rather than simply conservative.
Where uncertainty exists, managers can include a deliberate operating buffer separately instead of hiding it inside every customer duration.
Service Time Affects Vehicle Requirements
A vehicle can have enough physical capacity for more missions but insufficient time to complete them.
For example, several additional deliveries may fit by weight and volume. If their service activity pushes the route outside the driver-and-vehicle working window, another route may still be required.
A full vehicle is not necessarily a fully feasible route.
Service Time Changes Customer ETAs
An ETA for the tenth stop depends on what happens at the first nine.
If each earlier stop takes longer than planned, the difference accumulates along the route.
A five-minute error at one stop may be manageable. The same error repeated ten times can shift the expected arrival by nearly an hour.
Accurate service-duration data helps dispatchers:
Review route completion time
Evaluate customer windows
Identify overloaded routes
Set more realistic expectations
Recognize exceptions earlier
Compare planned and actual performance
The value is not perfect prediction. It is a more realistic operating plan.
How Service Time Affects Delivery Cost
Driver labour
More on-site time increases the hours required to complete a route.
Vehicle time
The vehicle remains committed while the driver performs the service activity.
Fleet requirements
Longer routes may require work to be divided across additional vehicles.
Overtime exposure
Underestimated routes can extend beyond the planned working window.
Failed deliveries
Missed customer windows may create another delivery attempt.
Planning administration
Dispatchers may need to move missions or rebuild later routes.
Customer service
Late or failed work can generate calls, complaints and account-management effort.
These effects should be measured against the operation’s baseline. Service-time improvement does not guarantee a fixed percentage cost reduction.
Separate Travel, Waiting and Service Where Useful
A single stop-duration value may be enough for some operations.
Others may benefit from distinguishing:
Parking and access
Waiting
Active unloading or service
Customer confirmation
Administration
Separating these components can help identify different solutions.
Time component
Possible improvement area
Parking and access
Site instructions or vehicle choice
Waiting
Customer window or appointment process
Unloading
Packaging, loading sequence or equipment
Active service
Process design or training
Confirmation
Driver workflow and customer readiness
Administration
Cleaner mission information
Not every component is controlled by route planning. Better data helps managers determine which part of the operation needs attention.
Use Customer Segments Instead of One Fleet-Wide Average
A single average can hide substantial variation.
Useful service-time segments may include:
Residential customers
Retail locations
Warehouses
Commercial buildings
Customers requiring appointments
Standard and priority work
Small and bulk deliveries
Pickup and delivery missions
Vehicle type
Depot or service area
Managers can start with a reasonable segment-level estimate and improve it as more operational evidence becomes available.
The median, range and recurring outliers can be more informative than the average alone.
Collect Service-Time Data Without Micromanaging Drivers
The purpose of service-time measurement is to improve route assumptions and operational processes.
It should not become a simplistic judgement of individual drivers.
Longer stop duration may be caused by:
Customer readiness
Difficult access
Delivery quantity
Required service activity
Documentation
Vehicle suitability
Missing instructions
A route-planning error
The driver mobile app keeps mission details, status and completion actions connected to field execution.
Operational reports and driver feedback can then help managers investigate recurring differences between planned and completed routes.
The useful question is, “What does this stop normally require?” rather than, “Why was this driver here for several minutes?”
A Practical Service-Time Improvement Process
Australian delivery teams can follow these steps:
Define which activities the service-duration field includes.
Identify important customer and mission segments.
Create an initial estimate for each segment.
Keep quantities, time windows and customer details current.
Generate routes using the recorded service duration.
Review route workloads before dispatch.
Compare planned and completed route duration.
Discuss recurring outliers with drivers and dispatchers.
Separate customer, process, data and route causes.
Update estimates using representative observations.
Retain a deliberate operating buffer where necessary.
Review the effect on routes, hours, vehicles and completion.
The process should improve gradually rather than changing every customer duration after one unusual visit.
Dispatcher Review Remains Important
A planner may use an accurate average and still encounter unusual work.
On the dispatcher map, operators can review route duration, ETAs, stop order and workload before sending routes to drivers.
Dispatchers may know that:
A customer is receiving an unusually large order
Building access has changed
A site requires an appointment
A driver is unfamiliar with the location
One route contains too many complex stops
A vehicle is unsuitable for the unloading conditions
That context can justify an adjustment before dispatch.
Software applies the recorded rules. Dispatchers review the exceptions the data cannot fully describe.
Metrics to Track
Useful service-time and route measures include:
Planned service minutes per stop
Actual or observed stop duration
Route service-time total
Travel time
Waiting time
Planned route duration
Actual route duration
Missions per route
Driver hours per completed mission
Routes outside the planned working window
Failed or rescheduled deliveries
Customer time-window performance
Cost per completed delivery
Rouptimize’s reports and analytics keep route, mission, driver and fleet results close to the operational workflow.
The article on cost-per-delivery metrics explains how route time contributes to the wider financial measure.
## Common Service-Time Planning Mistakes
Leaving service duration blank
This causes the route model to represent travel without the full stop workload.
Using one default for every customer
Different customer and mission types can require very different activities.
Padding every stop excessively
Overstated durations can create unnecessary routes and vehicles.
Updating data after one unusual visit
One exception may not represent the customer’s normal requirement.
Blaming drivers for every difference
Customer access, waiting and data quality may explain the result.
Ignoring quantity and vehicle type
The same customer can require different service times for different loads.
Measuring time without using it
Data collection creates value only when it improves future routes or operating processes.
Customer Experience Depends on Realistic Stop Planning
A customer does not care whether the previous nine stops were geographically close.
They care whether their delivery arrives within the expected period and whether the driver has enough time to complete it properly.
Realistic service-duration data can support:
More practical routes
Better customer-window planning
Clearer driver workloads
Earlier exception visibility
More reliable delivery expectations
Fewer preventable late-day failures
The historical operational data does not directly measure customer satisfaction or commercial savings. Those outcomes need customer-service, retention and financial evidence.
Measure What Happens After Arrival
Travel time gets the route to the customer.
Service time determines how long the vehicle and driver remain there.
When that activity is missing or inaccurate, route duration, ETAs, working hours and fleet requirements can all become unreliable.
Start free with Rouptimize and build route plans around the complete delivery workload, not distance alone.
Results-oriented and visionary CEO with a passion for innovation and a track record of transforming startups into industry leaders. Seeking a leadership role in a dynamic startup environment where I can leverage my strategic acumen, entrepreneurial spirit, and hands-on experience to drive growth, build high-performing teams, and deliver unparalleled value to customers. Committed to fostering a culture of creativity, adaptability, and sustainable success.
 Mohammad AlavitabarCEO @ Rouptimize